
Continuous Glucose Monitors: Does Better Accuracy Mean Better Glycemic Control?
Accuracy is good, but precision is essential.


Introduction
Pop quiz: Your CGM displays a glucose level of 120 mg/dL, but a finger-stick blood glucose meter (BGM) displays 180 mg/dL. What do you do next?
Take insulin because your “real” blood sugar is high.
Calibrate your CGM because the BGM is “more accurate”.
Ignore it because you don’t really understand how all this works anyway.
Sorry to say, it’s a trick question. To actually know what to do, and what not to do, you need to understand a lot more about how glucose actually moves around your body.
This article gets into the nitty gritty of how all this works, but here’s the summary:
Capillary blood glucose measurements—the finger-stick method—had been the gold standard for T1D management up until CGMs. But recent research (cited below) reveals that capillary measures (with rare exceptions) are not a proxy for systemic glucose levels. They never were, but had been erroneously assumed as such. Not only are they a very poor way to manage T1D (relative to CGM data), they can be deceptive in how one evaluates CGM performance or interpretation. This is one of THE most important physiological facts that must be understood.
Managing T1D is not about glucose levels by themselves, but glucose patterns: Trajectories and rates of change. The value of a CGM is not its accuracy, but its precision. That is, the degree in which you can rely on a sequence of adjacent readings and infer glucose trajectory and rate of change. Managing T1D is more about predicting short-term future time windows (30-90m), and CGM patterns are a vital element to doing that.
Interstitial fluids, which a CGM reads, is NOT a lag effect from blood, in most real-world conditions. That can and does happen, primarily in controlled lab studies, such as the clinical trials that establish CGM “accuracy”. But in the real world, many things contribute to how glucose moves throughout compartments, and they are not evenly distributed. A critical chart below illustrates this.
Lastly, there is an upper limit on how well a CGM can possibly perform given the physiology of glucose movements. Aiming (or hoping) for better is a fool’s errand at this point in CGM technology. Measurements like MARD, which compare the measurements from a CGM to capillary blood, are useless in the real world.
Much of the details of this article come from a variety of published articles in well-established, peer-reviewed medical journals. A leading paper on glucose is this rigorous investigation, Differences in venous, capillary and interstitial glucose concentrations.
The Pleus et al. (2023) study demonstrates that glucose concentrations measured in venous, capillary, and interstitial compartments diverge significantly after a glucose load, with median differences exceeding 30% at 60 and 120 minutes post-ingestion—even in non-diabetic subjects. These discrepancies are not merely technical artifacts, but reflect real physiological compartmentalization and time-lag effects, which are further compounded by device-specific calibration and signal processing.
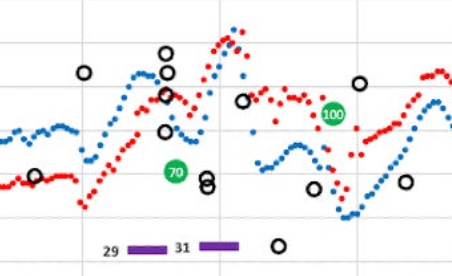
In other words, the more volatile systemic glucose levels are—that is, your whole body’s glucose levels, not just anywhere in particular—the more variability you’re going to see in each of these compartments. This is why and when a BGM reading rarely matches a CGM. Below is a snapshot from my own data that will be explored in detail later in this article. But for this context, notice how BGM (capillary glucose) readings (the black dots) are entirely useless, both for managing T1D, but their relative relevance to either the G6 or the G7.
The true nature of T1D management, whether you make your own decisions, or rely on an automated pump, is the ability to identify and react to glucose patterns. The true differences in CGMs rests entirely on how well they estimate these trajectories and rates of change. It’s not MARD.
This is not just conjecture. The article, “Limits to the Evaluation of the Accuracy of Continuous Glucose Monitoring Systems by Clinical Trials”, describes the erratic and random patterns of glucose fluctuations, and call into question the appropriateness of how clinical trials for CGMs are conducted in the first place. Popular metrics (like MARD) can be misleading without considering trends and consistency.
Self-managing T1D does not require the sophisticated level of understanding of these findings, but only the top-level headline: Learning to see—and react to—glucose patterns is the way to achieve healthy glycemic control. You therefore need a CGM that produces good, reliable, actionable data. Noise is not actionable. This especially true for those who use automated insulin pumps.
“Accuracy” is more of a marketing term than a meaningful measure of a CGM’s utility.
Real-World Scenario
Let’s return to the chart at the top of this article, which I’ve copied below.
The G7 (red) is purportedly “more accurate” than the G6 (blue) because it meticulously measures each sample of fluid. The G6, by contrast, is doing a more sophisticated analysis on a series of signals it gets from the sensor and makes a more “precise” inference on what the body’s glucose levels are.
No, this is not just a matter of “smoothing” the data, because each read is new, on its own. Prior data is not modified. Determining “precision” is a far more physiological complex algorithm understands that systemic glucose levels cannot possibly move in huge jumps, up or down. The G7’s data shows individual sample variation, but that kind of variation is not physiologically possible throughout your entire body.
Put that into context with the pop quiz at the beginning: A finger-prick blood glucose test shows 180 mg/dL, while the CGM shows 120. Which reading is more reliable if you were to take action?
If you were to treat the 180 value as “correct,” despite the fact that the CGM pattern (in either sensor) was not just elsewhere, but moving in a confirmed direction, this could be a bad judgment. Let’s say you administer 2u of insulin because that’s what you’d do for a “true” glucose reading of 180. But, if that was more of an anomaly due to the erratic nature of glucose movement, you’d likely be facing a severe hypo even in about a half hour.
If you’re a T1D and learning to make in-the-moment management decisions—or rely on an automated insulin pump to read this data—knowing this is important.
Let’s try another quiz: Below is a familiar screenshot from the Dexcom G6 app:
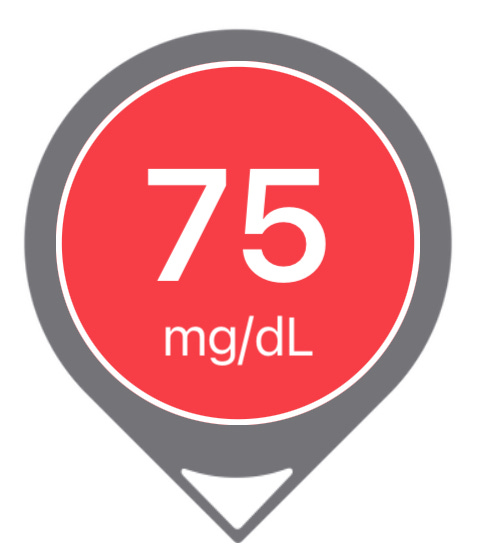
The “down arrow” on this Dexcom reading indicates glucose levels are dropping. And yes, 75 is definitely low. What do you do?
If you think you should eat to avoid a hypo, let’s expand to see the whole chart now:
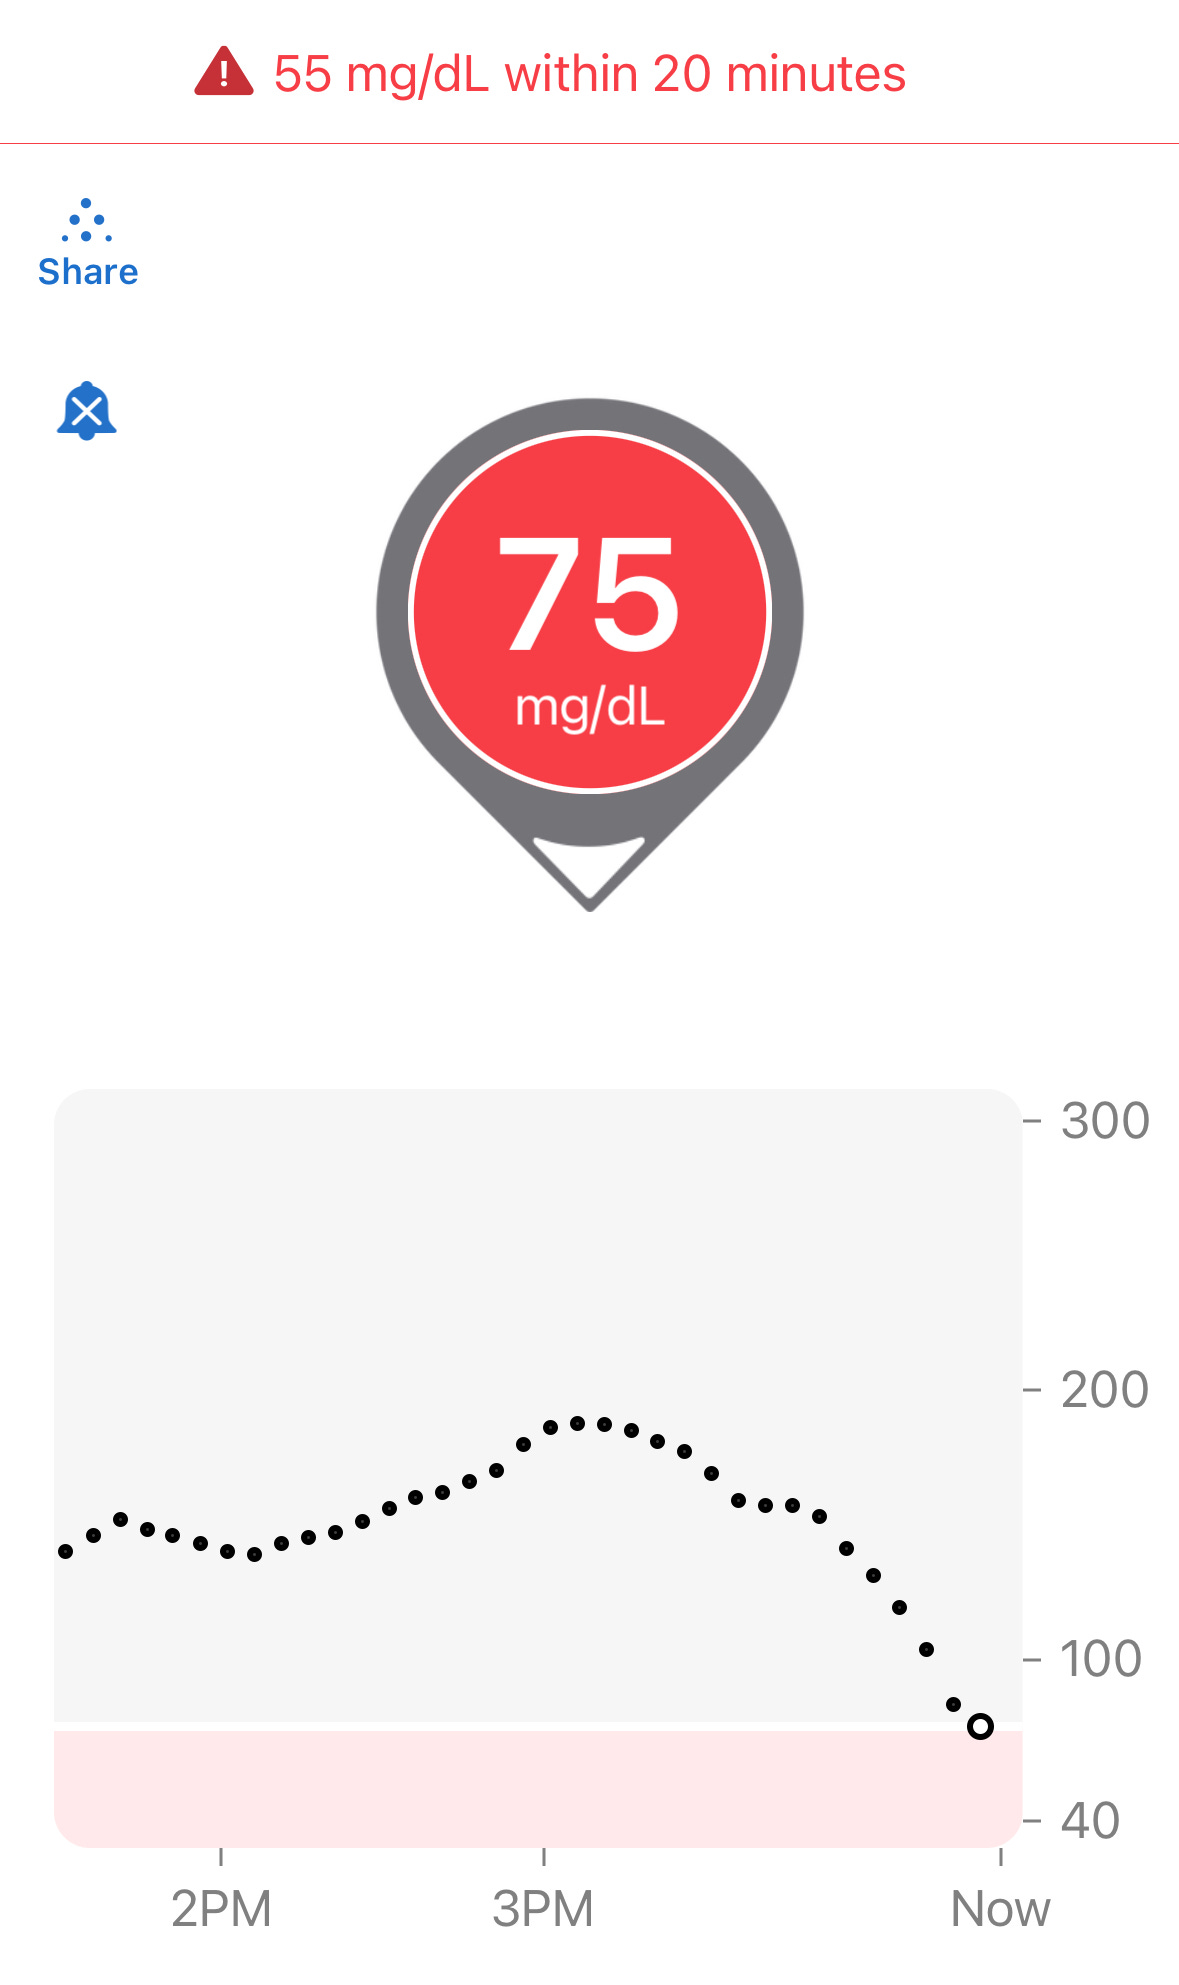
Now that you see the whole chart, you could well be right. The levels were quite high (180s), then dropped to roughly the 150s, and then suddenly took a dive in the last 30 minutes.
But wait. We can also see that it’s starting to level off. Yes, only ONE reading suggests this tapering off, similarly to how it leveled off in the 150s. Will it do it again? Will it pop back up? Will it continue downward?
That’s why I ignore directional arrows—it can’t answer these questions. And worse, it can be misleading, as the down-arrow may continue until glucose levels rise. If the pattern suggests it’s already leveling off, and you only look at the arrow, you may think it’s still dropping, and needless eat—or eat too much.
In this case, I knew when I dosed last, and when I ate last, and my experience suggested that I should not eat anything so to avoid a glucose spike.
Looking at the chart later, after time has passed, we see more information.
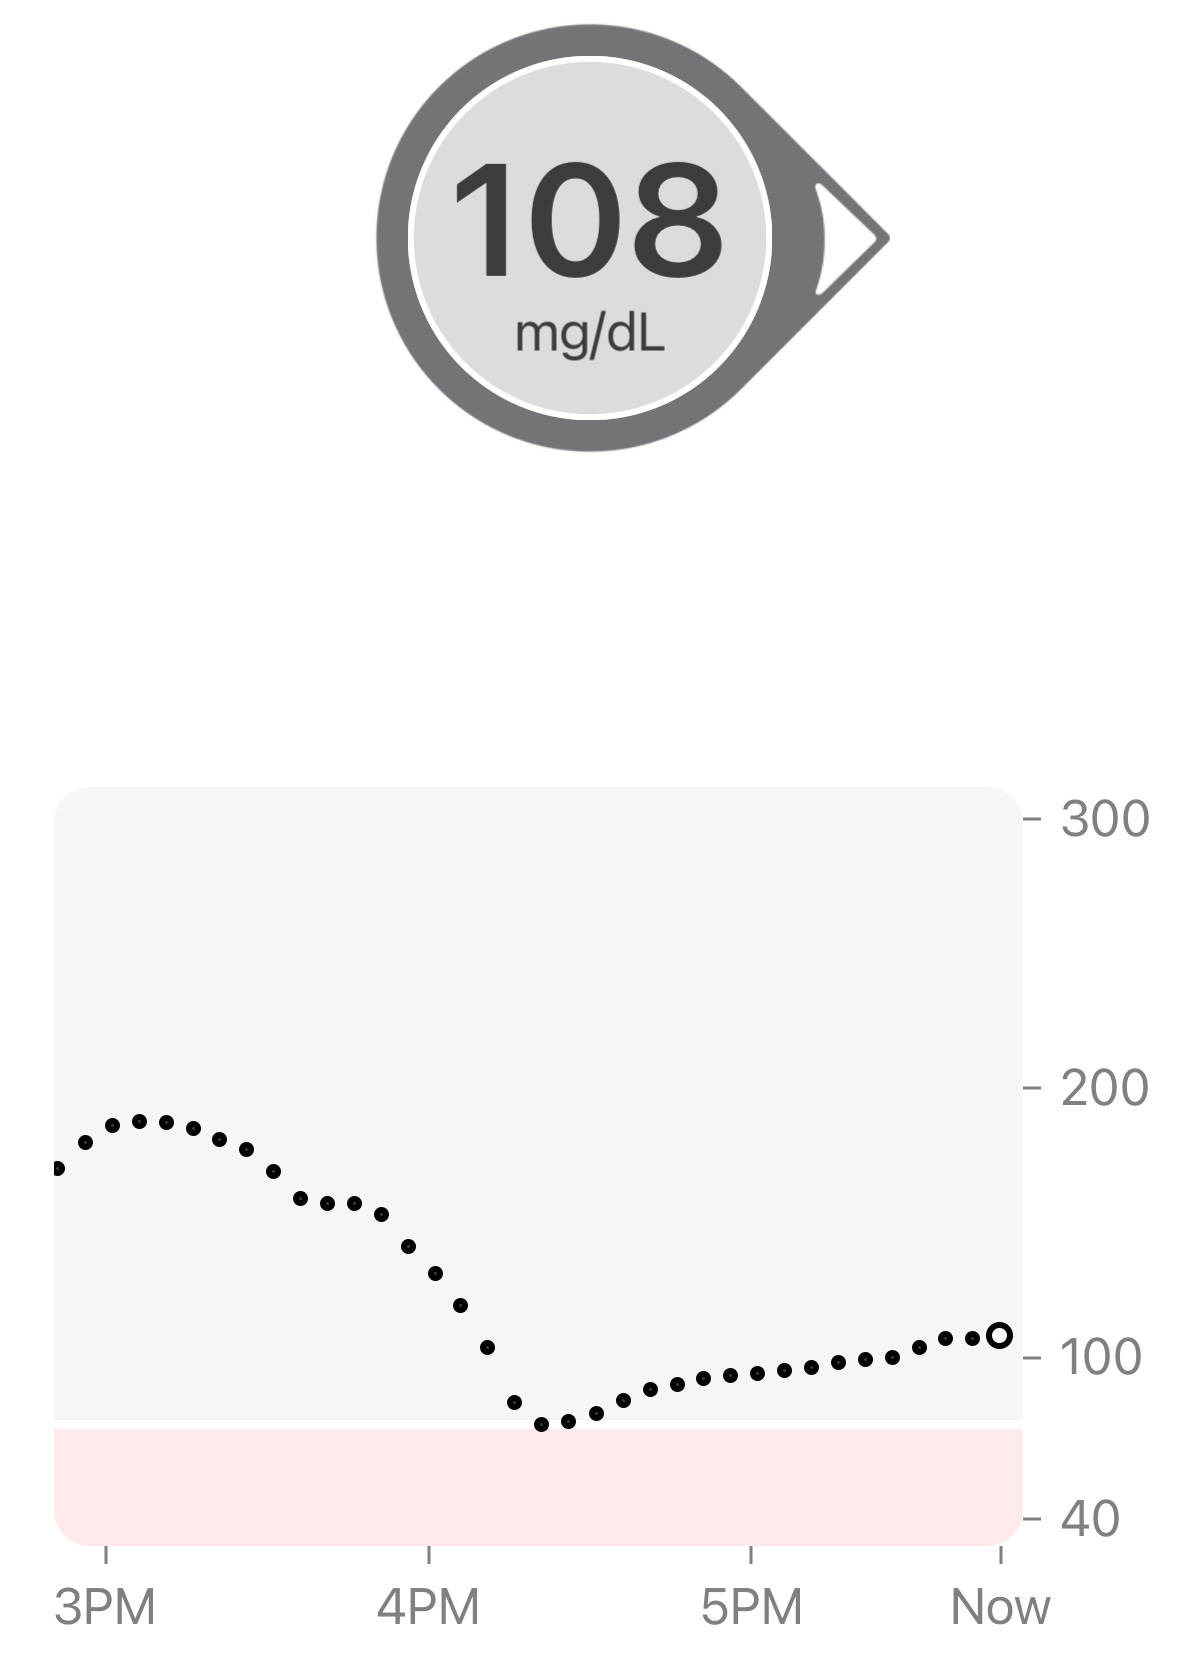
Hey! 108 is a good number, and the slight upward trend doesn’t bother me. Still, I’ll keep an eye on it.
Here’s the thing that made all this happen: I TRUSTED THE G6 DATA. It was smooth, the trend line was reliable, and the readings did not wobble around. Most importantly, it was TIMELY. I was able to make an in-the-moment decision when it was at 75. By contrast, if the data was “wobbly,” I would have had to wait longer—potentially much longer—before the pattern stabilized, and by then, it might have been too late had I actually needed an intervention.
To illustrate the wobbly nature of data, let’s look at that G6/G7 chart and zoom in on the 4:00pm window. Here’s an enlargement of that data:

The G6 data is smooth, but the G7 is bouncing all around like a buoy bobbing in turbulent ocean waters. Each G7 reading may well be “accurate” in isolation, but they offer no help in determining directionality or rate of change.
I’ll return to this screenshot later in this article, but you can easily see that the differences between the G6 and G7 are clear and obvious: I can rely on the G6 data to make an informed decision, but anomalous spikes or dips that the G7 produces are intermittent and—by themselves—are entirely unreliable.
Now, let’s be honest. you may not be watching your CGM like this. In fact, you may be using an automated insulin pump to do that work. But remember, those systems are doing exactly the same read-by-read analysis that I do for myself, making the same in-the-moment decisions. No algorithm can figure out G7 data any better than you can. So, those systems won’t work if the data being observed is not reliable enough. Garbage in, garbage out.
And that’s where the risk lies with G7 data. But more importantly, that’s where the risk lies with so-called “accurate” data. You don’t want accuracy, you want precision.
Read that bold text again—seriously. Out loud. With a British accent if you must. It’s that important.
Now let’s expand this to the wider data I collected over a month
Does the G7 yield greater glucose control?
Before I explain how I tested the G6 vs the G7, I need to make it clear that Dexcom’s clinical trial that demonstrated the MARD level for the G7 was not intended to claim that the G7 resulted in healthier outcomes. That’s a very different goal. The company only intended to conduct an “efficacy trial,” which is only intended to show that the sensor was good enough to be approved by the FDA.
What Dexcom did not do is perform an “effectiveness trial,” which is when test subjects would wear each of the two sensors and make real-time management decisions under real-world conditions. I explain this in much greater detail in my article on how to evaluate clinical trials.
Since no trials have tested the G7 this way, I did it on myself. As it happens, my T1D is under very tight control, where my time in range is 95%, with <2% below range (70 mg/dL) and <4% above range (180 mg/dL).
NOTE: I do not aim for this level of tight control. I do not have “targets” in mind. I am not fanatical or obsessed about numbers. I am not on a low-carb diet. I merely follow the four basic habits of T1D management, which I describe in my article, The Four Habits of Healthy T1Ds. Habit #1: Watch your CGM and get to know your patterns; Habit #2: Make small interventions with carbs or insulin “as needed.”
You can read the article to see what habits #3 and #4 are.
During March, 2023, I wore both the G6 and G7 at the same time, but would only observe data from one sensor’s app at a time to make real-time management decisions. That’s right, I did NOT look at both apps and compare them in real-time. My goal was to determine which data made it easier or better to make in-the-moment decisions. After a period of a few days, I switched to the other sensor’s app. I repeated this back-and-forth between the two sensors several times.
Upon completion of the experiment, I downloaded all my data to Excel and analyzed it to see how my TIR varied between the two. I also collected data for insulin (InPen bluetooth enabled insulin pen), carbohydrates, exercise, sleep, and glucose levels from my Contour Next One blood glucose meter (BGM), which I included in my analysis report.
The graphic below is the topline dashboard from my month wearing both the G6 and G7:

The first thing that pops out is that the G7 reported glucose values ~5% lower than the G6, which is consistent with what others have reported online. Aside from that, the two sensors appear roughly equivalent: The G6 averaged 121 mg/dL, versus the G7’s 116, and the standard deviations (SD) were 33 vs. 34, respectively.
But the real difference between the two sensors is shown by the time-in-range (TIR) stats on a day-by-day basis, as shown in the following graph:

You’ll notice the periodic pattern, where my TIR is very high, followed by days when my TIR slipped. These variations are entirely due to which sensor’s data I looked at the make in-the-moment decisions. When I used the G6 to make decisions, I achieved a TIR of >90%. When I used the G7, my TIR dropped to the ~70% range. The reason is obvious: The G7 data would at time present patterns that looked like my glucose levels were moving in a particular direction at a particular rate, which would have meant either taking insulin or consuming carbs. But in actuality, those patterns were anomalies, so my actions would cause my real glucose levels to go off in the wrong direction. And sometimes, dangerously so.
Let’s zoom into the two-hour window between 4-6pm that I illustrated earlier. This kind of movement is highly representative of the kind of volatility seen in the G7 versus the G6, and why it’s hard to make real-time decisions.
Remember, I couldn’t see the G6 data (the smoother blue graph), so at 5:30pm, and with only the G7 data in view, I saw the very rapid rise from 88 to 155 in a matter of 30 minutes. Granted, the data leading up to that was highly erratic, but these successive readings were not–they were decisively rising, and fast. Without any idea where these levels might top out, especially given the rapid rate of change, I thought I needed to start bolusing.
As I always do, I began with small, incremental boluses, keeping a close eye on those glucose levels as they rise, waiting to see when they level off or begin to fall. The goal is to avoid taking too much, or too little. I’m aiming for the Goldilocks effect.
Turns out, the G7’s data shot up to 270. If this really was my real glucose level, the stacked boluses I’d taken would have perfectly corrected these readings, and I would have had a soft landing. But, as the insulin started to kick in, my glucose levels plummeted to 49, making it clear to me that the G7 readings were not giving me reliable information. Individual readings may have been “accurate,” but they were not representative of my actual systemic glucose levels.
To achieve tight glucose control, one must be able to look at short time windows, and respond quickly to glucose movements to glucose movements, even if they are finely tuned adjustments. (Most people aren’t in tight control, and typically work on bigger time windows, so they won’t be as affected by these erratic readings.)
Over time, these anomalous readings will create more errors in decisions (or pump algorithms) than successes, which will impose an upper limit on how well they can ever perform.
Below are more daily charts to consider (without additional commentary). You can zoom in on your own and guess how/why I was able–or unable–to see trends in time to make decisions proactively.

The G7 generally reports lower BG values

While both the G6 and G7 were tighter (SD=29 and 28), the G7’s volatility is apparent.

The G7 appears to behave better this day, but real-time decisions were based on G6 data

The day was 100% in range, but the G7’s data was all over the map. (Thanks, G6!)
The Dexcom G7 trial: Exploring the futility of “accuracy.”
In Dexcom’s published report, “Accuracy and Safety of Dexcom G7 Continuous Glucose Monitoring in Adults with Diabetes,” 318 diabetic subjects wore three G7 sensors simultaneously over the course of ten days. For three of these days, subjects underwent clinically induced hyperglycemia and hypoglycemia under controlled conditions, where blood samples were taken and measured using a reference blood glucose sensor, the YSI 2300 Stat Plus glucose analyzer. The analysis showed that the “mean absolute relative difference” (MARD) between the two was ~8.8% for the G7, versus ~10% for the G6. The lower the percentage, the smaller the difference to the reference analyzer. Hence, greater accuracy.
Let me remind the reader that the G7 trial had subjects where THREE G7s simultaneously during the testing period. When blood samples were taken and measured on the iStat device, it then compared that value to G7 readings.
Ok, wait. If the person was wearing three G7’s, which one was used to compare measurements? Or were all three averaged together? Or, did Dexcom choose which of the three that happened to be closest to the iStat? The company doesn’t reveal this in the trial data, and that alone raises eyebrows to me.
All this further substantiates the paper I cited earlier about the inappropriateness of using CGM values against a single-read iStat device. Any claims about MARD should not be taken at face value.
Moreover, MARD values in Dexcom’s data varied widely, especially under different conditions, such as glucose levels and rates of change, as shown in this figure from their report.

The mean and median per-sensor MARDs were 8.8% and 7.8%, respectively, 442 (71.4%) had MARD values <10%, and 12 (1.9%) had MARD values >20%.
According Dexcom’s data, the G7’s MARD value was best when glucose values were in the sweet spot of glycemic ranges, but diminished as glucose levels edged higher. This bar graph suggests the best MARD happened most often at ideal glucose ranges, but most T1Ds only spend about 30% of their day in those ranges. The rest of their day is spent far outside, usually well above 180 mg/dL, where the G7’s MARD rating is well above 14%.
What is also not revealed in Dexcom’s report is the rate of change (ROC), which can also greatly affect MARD. Dexcom limited its testing to only 1 mg/dL change per minute, which showed some of the worst performing MARD values. In the real world, once a T1D eats a meal, glycemic levels can change at 2-4 mg/dL per minute as a matter of course. Relying on CGMs to capture that data is prone to significant error bars. (The G6’s algorithm is far superior in this regard for smoothing out these errors and giving the user or algorithm more reliable data to work with.)
To what degree this variability in MARD plays into real-world conditions, we can look at this meta-analysis of multiple studies on overall glucose levels for T1Ds who wear CGMs. It shows that only 30% of T1Ds have glucose ranges between 70-180 mg/dL 70% of the time, which is where the G7 is most accurate. By contrast, 80% of T1Ds spend more than 70% of their time above 180 md/dL, where the G7’s accuracy exceeds 30% error. (For context, 44.5% have an A1c between 7–9%, 32.5% exceed 9%, and only 23% of T1Ds had an A1c <7%.)
Despite the fact that the G7 is the most accurate at glucose levels between 70-180, T1Ds spend far more time far above 180. Hence, T1Ds are experiencing accuracy error rates of >30% most of the time. This means that decisions that either humans or algorithms are going to make in whether to dose insulin or carbs are dealing with highly imperfect information (especially compared to the G6, which was more reliable.
Summary
I personally suspect that few people will find the G7 helps T1Ds improve their glycemic control. This will also be a problem for automated insulin pumps for the same reasons.
Nevertheless, I suspect Dexcom is primarily focused on the value of the improved MARD rating in their marketing plans. It’s invaluable to claim that your MARD is superior to all other CGMs, regardless of the dubious value of MARD.
It also helps that Dexcom’s target market is moving well beyond T1Ds into the T2D market, where there are nearly 40 million T2Ds, with another 98 million presumed to be undiagnosed. That, plus a very rapidly emerging market of non-diabetic “life-hackers”, such as athletes, health enthusiasts, and everyday consumers. In fact, Dexcom has released a non-prescription version of the G7 called Stelo, and these people don’t care that much about volatility.
Of course, the downside for T1Ds is that some could actually see worse outcomes, and not even realize it. The G7’s propensity to report lower average glucose averages (than what is actually in the bloodstream) may give people the false impression that their glycemic control has actually improved with the G7.
I hope the G6 never goes away. But a better idea is to provide the G6’s algorithms to a G7 sensor. Here’s a marketing plan: Sell the G7 with the G6 algorithm as the less expensive over-the-counter product for the comparatively fewer number of T1Ds that actually need higher quality data—that is, better precision—to manage glucose levels. We’re already paying too much for all the other stuff we have to buy, and we’re a tiny market compared to the rest of the world. This way, everyone’s a winner!
Thank you for this article! This is the best explanation I have seen on the smoothing of the G6 data vs the G7 and its impact. I use a tandem pump and I usually get mid-80s TIR and now know why I may be struggling to get to 90. I have very good control and this helps explain the “diabetes is just weird sometimes” phenomenom.
I suspect Freestyle Libre 3 is even “worse” than G7 with it’s MARD of 7.9% and one minute sampling rate. G7 on steroids :D I switched recently from G6 and what a ride I had yesterday when trying to fix one hypo got 3 consecutive nasty ones instead (tried to bolus after each climb out of low so that blood sugar wouldn’t skyrocket later). The readings just aren’t as predictable, they jump around and I ended up reacting too soon… But I will keep using it, who knows I might see some patterns in time and get a handle of it hopefully, I just like every minute readings too much.