
HbA1c Tests and T1D: The Good, The Bad and the Ugly
The ways the test affects diabetes management are complicated


We all know the drill: In preparation for your next doctor’s appointment, you get an HbA1c test to see what your average glucose levels were over the last ninety days. When the doctor reviews the results with you, you’re likely to hear something like, “Let’s see how we can get that lower.”
“Ok,” you think. “Lower is better, right? So, what is the ideal A1c for T1Ds?”
Ah, therein lies a good and complicated question. Turns out, A1c tests are not that simple.
The A1c test has become an essential tool for all manner of detecting and monitoring glycemic control, whether it’s diagnosing diabetes among the population at large, or assessing an individual’s T1D health.
And yet, the A1c test is far more complicated than most people think, not just the technical aspect, but the implications of results. Yes, it brings many benefits, but it can also create a great deal of confusion, and even lead to bad outcomes if results are improperly interpreted.
Got it. So, what’s the best A1c level for T1Ds?
We’re getting there.
Why the A1c test is interesting
Today’s HbA1c test evolved from a series of previous assays (clinical tests involving chemistries) dating back to the early 1970s. But it wasn’t really standardized till the 1980s, where it then became routinely used in clinical care for diabetics. For an enjoyable night of light reading, the NIH paper, “HbA1c Standardisation: History, Science and Politics,” provides fascinating facts and narratives that would even make John Grisham blush.
I’m kidding. That NIH article is so technically dense, it should not be read by anyone operating heavy machinery, as it can induce drowsiness. For example, this is a representative excerpt from the text. Go ahead and try to pronounce each word:
“In 1981 Mallia et al. described a method that separated GHb based on the binding of the cisdiol groups of the glucose to m-amino phenylboronic acid cross-linked on agarose. GHb binds to the affinity resin, whilst non-glycated haemoglobin does not bind. Quantitation is by spectrophotometry at 415 nm of the glycated and non-glycated fractions.”
Your eyes are glazing over. I get it. Even if you think you know what “phenylboronic acid” is, any paper that uses the word ‘whilst’ is signaling to the reader that a glass of brandy or sherry may be advised whilst reading.
But the key to understanding the A1c test is that it counts (quantitates) the red blood cells (RBC) that have glucose attached to them (glycated). Because RBCs grow and die in our bodies over an average of 90 days, the test normalizes newer RBCs (which will have far less glucose attached) to older RBCs (which will have more) to impute the “average.”
Sounds straightforward, right? So, again, what’s the best A1c level for T1Ds?
Relax. This is important background info. It’s coming. We first need to acknowledge, however, that the 90-day lifespan of RBCs is the average, not a universally true timeframe. Those whose RBCs have lifespans that last longer or shorter will have A1c values that are discordant with how much actual glucose has been in their system over the past 90 days. Also, the size of their RBCs can vary considerably, which means that the amount of glucose attached to them will vary, with smaller cells having fewer glucose molecules attached, translating to lower A1c values, even if the actual amount of glucose in their system would otherwise produce a higher value. There are other confounding factors as well, such as certain types of blood disorders (iron deficiency, etc.), illnesses, and so on.
Now, to be sure, these may only nudge the value a small amount, but in some cases, it can be as great as a whole percent. Rare, but it happens.
You may be wondering why we use it anyway. Ah, now we’re getting into the weeds. There are good uses for A1c values too. Let’s start there.
The Good…
The first major trial conducted using the A1c was the Diabetes Complications Control Trial (DCCT), from 1982–1993. The findings established that high glucose levels (measured by A1c tests) directly correlated to microvascular complications, such as retinopathy (leading to blindness), kidney disease, and neuropathy. Believe it or not, there was disagreement in the community as to whether T1Ds’ various comorbidities were because of high glucose levels, or whether T1Ds were just genetically more susceptible as a consequence of their systemic immune and metabolic disorders. The control group employed tighter insulin dosing methods, which lowered their overall A1c values, which directly correlated to their having had fewer adverse microvascular incidents.
The DCCT was the first study to make a direct inference of causality, verses mere correlation. That is, A1c levels that exceed 7.0% marked the point where microvascular complications begin. The higher the A1c level, outcomes got progressively worse.
At this point, the American Diabetes Association recommended that 7% is the target for T1Ds, and aggressive insulin therapy was the way to do it.
But, that’s not easy. The T1D Exchange reports that the percentage of T1Ds whose A1c levels have achieved the ADA goal of <7.0% (<53 mmol/mol) was only 17% for children and adolescents <18 years old, and only 21% for adults. At the next level up, only 37% of adults achieved <7.5% (<58 mmol/mol).
Here, we have established a very good use for A1c tests: Establishing wide guidelines that apply to populations, it can be easily and inexpensively administered, and can tell us good information about the state of health.
So, does that mean that an A1c of 7% is the best for T1Ds?
Well, again, it’s complicated. The “best” A1c is not necessarily the “healthiest” A1c.
“Healthy” A1c levels
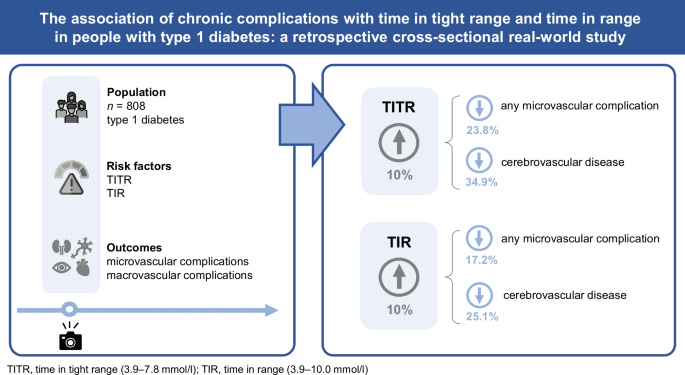
Let’s start with what the medical literature says: The healthiest A1c is roughly at or below 6%, as measured by all-cause mortality among the population at large. Indeed, there’s a linear correlation between A1c levels and health outcomes, as described in the paper, “The association of chronic complications with time in tight range and time in range in people with type 1 diabetes: a retrospective cross-sectional real-world study.” The following graphic from that paper shows that a 10% increase for time in tight range resulted in a decrease of 23.8% of cardiovascular disease, and 34.9% of strokes.
In other words, “healthy” A1c levels are far below 7%. So, why does the ADA recommend 7%? The answer is also complicated, and blends into another article I wrote about the gulf between public policy and “personal health” guidelines. I won’t get into the details here, but making policy has different aims: to set guidelines that can be adopted by a large number of people within a healthcare system that cannot give everyone that type of individualized attention they need. And to achieve lower A1c levels safely is not really that easy. The ADA doesn’t want to make guidelines that only a few people can achieve, while putting at serious risk those who don’t achieve it.
That brings us to how A1c levels can be misused:
The Bad…
One of the worst uses of the A1c is to use it to assess daily management regimens. In fact, it can bring more harm than good, specifically because of that trade-off I mentioned earlier: the goal of “lowering” A1c values comes with risks because the overabundance of insulin can be just as harmful as the overabundance of glucose.
That’s right, hyperinsulinemia—having too much insulin in your bloodstream—can cause atherosclerosis, which leads to cardiovascular disease.
While this has long been known to be true by data associated with T2Ds, it took a while before the DCCT data was scrutinized more carefully to observe that T1Ds who treated glucose intensively with insulin were also suffering from ASCVD as well. In the 2014 article in Diabetes Care, The Diabetes Control and Complications Trial/Epidemiology of Diabetes Interventions and Complications Study at 30 Years: Overview, the authors found that, while those who were under tighter control didn’t suffer microvascular damage as much, there was an increase of macrovascular damage, including cardiovascular disease (CVD), leading to heart attacks and strokes, among other comorbidities.
To achieve lower A1c values, the increase in insulin protocols since the DCCT has seen the rate of obesity in T1Ds rising precipitously, leading to many of the complications associated with type 2 diabetes: insulin resistance, kidney and liver disease, etc. In a meta-analysis titled, “Obesity in Type 1 Diabetes: Pathophysiology, Clinical Impact, and Mechanisms,” obesity in adults with T1D rose from 3.4% at baseline (1986 to 1988, prior to the DCCT) to 22.7% in 2004 to 2007. The most recent data, according to the Lancet article, “Obesity in people living with type 1 diabetes,” shows that T1D obesity is now at 37% in 2023.
That Lancet article further explains that hypoglycemia is another major side effect of hyperinsulinemia (taking too much insulin), which introduces its own constellation of problems, including loss of cognitive function, cardiac dysrhythmias, and a series of cascading events that can lead to hospitalization and death.
Lastly, excess insulin can also lead to dramatic glycemic variability (GV)–the rapid swings between high and low glucose values–even within tighter ranges. In the paper, “Glycemic Variability: How Do We Measure It and Why Is It Important?,” researchers cite GV as a major contributor to cardiovascular disease, oxidative stress, inflammation and other hormonal responses that cause greater harm than if glucose values simply remained higher. In the paper, “Oscillating glucose is more deleterious to endothelial function and oxidative stress than mean glucose in normal and type 2 diabetic patients,” the authors showed that greater oscillation in glucose levels was more closely associated with these negative effects than higher average glucose levels.
That physiological phenomenon is not widely known or appreciated among clinicians, which is worth pondering whilst you take another sip of sherry.
All this is the direct byproduct of the DCCT and clinicians’ oversimplification of the value of lower A1c levels and the practice of prescribing higher doses of insulin than is actually needed. This puts T1Ds in a no-win situation: They suffer when their glucose levels are too high, but taking too much insulin causes weight gain and frequent hypoglycemia. Trying to find the Goldilox middle is riddled with risks.
Clinicians face a daunting problem, to be sure. What T1Ds need to do is customize their insulin regimen on an individualized basis, but that’s very hard to do for reasons described in “Four Essential Diabetes Facts You Never Knew”: Creating a personalized T1D protocol requires knowing how to do it, which T1Ds can’t do unless they’ve done it. Doctor’s can’t do it for them because the metabolic system is too individualized—it can' only be refined by patients themselves.
And that leads us to the really confounding problem with the A1c test that you keep wondering: What is an ideal A1c level that T1Ds should aim for?
…and the ugly
When it comes to individualized T1D management, “What’s the ideal A1c level?” is the wrong question to ask. The A1c only measures one thing: Average glucose levels, and there are more variables needed to know whether you’re in good control. You want to avoid hypoglycemia, and minimize glycemic variability, both of which can be highly damaging to the human body, but cannot be revealed through A1c tests. And, above all, you don’t want to take excessive levels of insulin to manage glucose levels.
Hint: exercise is the best, fastest, and healthiest way to drain glucose from your system. For more on this see, my article, The Paradox of Low-Carb Diets: A1c vs. Metabolic Health.
A1c tests really should not be a part of one’s daily management metrics. Sure, it’s nice to know the value, but to truly assess T1D management “quality,” what you really need is a CGM (continuous glucose monitor) that tracks how much time you spend “in range” (as well as above and below). Here, the “range” is 70-180 mg/dL, which is where a normoglycemic person’s glucose levels tend to be.
In a paper titled, “Clinical Targets for Continuous Glucose Monitoring Data Interpretation: Recommendations From the International Consensus on Time in Range,” the authors make the following recommendations:
Your daily average glucose levels (70-180 md/dL) should be at least 70% of the day.
The variability between highs and the lows, also known as the coefficient of variance (CV%) should be less than <36%.
No more than 3% of the day should be <70 mg/dL
No more than 25% of the day should be >180 mg/dL.
As all T1Ds know, keeping glucose values tight (at any range) is hard. That’s what the DCCT showed—that tighter glycemic ranges resulted in fewer complications. Because these tighter-controlled people also had lower A1c values, people assumed that it was the “lower A1c values” that did the track, so they prescribed “more insulin.” That was the wrong take-away lesson. Instead, it should have been “more intelligent insulin regimens.” Big difference.
Reducing glycemic variability requires significant self-discipline, and that’s the hardest part of self-management. If you can reduce the CV% value, chances are almost assured that your average glucose levels will also be lower, just as the DCCT showed.
For now, understand that adequate measuring tools and techniques is the only way to design good T1D management protocols, and A1c levels is not a good way to do it.
Think about that whilst you contemplate how much insulin you take.
[ Further reading: The Fallacy of Average: How Using HbA1c Alone to Assess Glycemic Control Can Be Misleading. Roy W. Beck, Diabetes Care 2017;40(8):994–999 ]
I appreciate you putting this out there. I have read the studies you have cited before, I have been frustrated by this issue for years. I am a Type 1, diagnosed 38 years ago. I have gone through many endocrinologists and other clinicians who have pushed lower A1C but they did not fully comprehended the ramifications of what they were doing. A1C is an average. My concern is no one talks about lowering the standard deviation (SD) in my blood sugars readings. If we are able to close the gap in the SD, in addition to lowering it, we would be in better control. Unfortunately this comes back on us to do as patients, and in many cases trying to reduce the damage that has been done already by rollercoaster blood sugars resulting from pushing to get lower a A1C.